
Germany has, until now, remained a data desert with respect to information on the distribution of wealth, particularly at the top end of the distribution. While many other countries, e.g. the U.S., use administrative data to over-sample the very wealth in general population surveys, this strategy cannot be implemented in Germany because the corresponding administrative data does not exist. A team at the DIW/SOEP has now found a novel way of sampling the rich via register information on company ownership. The basic idea is the following: data in the U.S. and other countries show that the richest members of society hold substantial stakes in businesses. Thus, by finding those individuals who do so, one can identify the richest individuals.
The SOEP team combined data on shareholding and balance sheets from the Orbis database to construct a list of the richest German residents in terms of the value of their business assets. The detailed data preparation included the conduct of over 2000 personal interviews among the top 1% of business asset holders. The results of a pretest of this effort are presented in Schröder et al. (2020a). Schröder et al. (2020b) presents the results from the full implementation in the SOEP panel study. 881 individuals in the sample – “SOEP-P” – hold individual net wealth of more than one million Euros and they are, on average, 21 times as wealthy as the members of the regular SOEP panel.
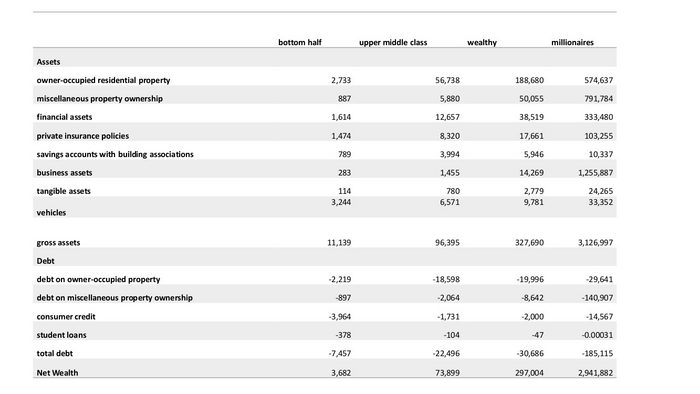
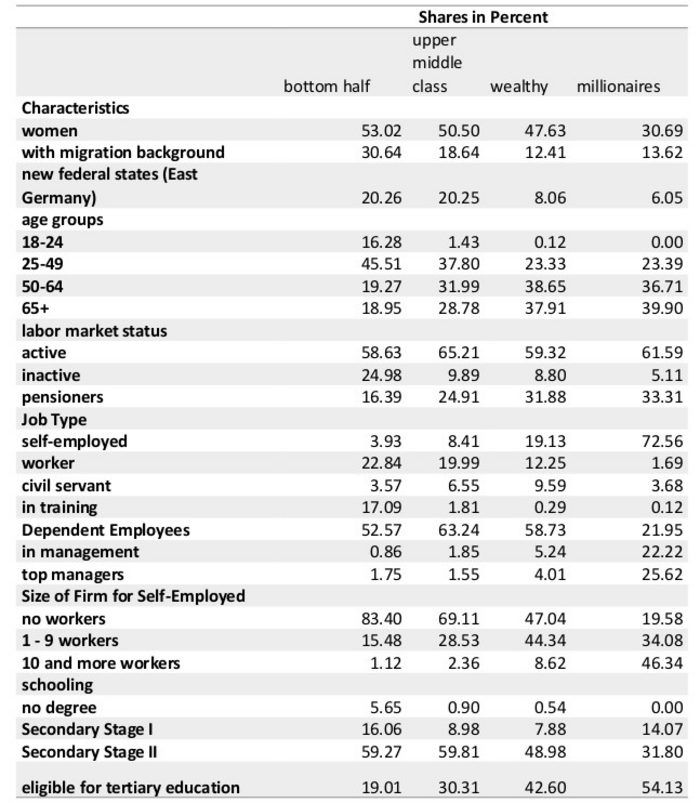
Numerous salient facts about the wealthy emerge by comparing net wealth millionaires with that of the rest of the population. Millionaires in Germany are relatively old and tend to be male, well educated, and from the western part of the country. Further, the compositions of the millionaires’ portfolios are very different from those held by the rest of the population: about 40% of wealth is invested in business assets and about 25% in non-owner-occupied property. Both of these are portfolio components geared towards earning returns. Millionaires are also significantly more satisfied with their life than the rest of the population: on a scale of 0 to 10, millionaires rate their overall satisfaction at 8.2, while the next lower wealth group (76th to 98th percentile) merely rate their satisfaction at 7.6. If they work, millionaires put in about 10 more work hours each week, relative to the rest of the working population. Statistically, this difference is related to the millionaires’ frequent involvements in self-employment and entrepreneurship: 73% of millionaires are self-employed and, among these, 46% run businesses with 10 or more employees.
The new top-wealth sample changes our perception of wealth inequality in Germany. When integrating SOEP, SOEP-P, and the rich list of Manager Magazin, we find that the top 1% of wealthiest own a share of about 35% of overall wealth, while the corresponding number would be 21% if based only on the SOEP. These facts are relevant for policy discussions around wealth taxation. In addition, we may learn much more that is new from the top-wealth sample. For example, macroeconomic research focusses more and more around Heterogeneous Agent New Keynesian models (see Kaplan et al., 2018) that pay special attention to the distribution and composition of wealth; the new sample can help testing and parametrizing these models. Another line of future research will focus on the dynamics of labor supply and savings behavior of the rich, to be observed as the data collection continues in the coming years.
The final columns of Table 1 and Table 2, respectively, present some statistics of the new sample, in brief comparison to the full SOEP sample. We point the reader to Schröder et al. (2020b) for a wider discussion.
Table 1: Socio-Demographic Characteristics for Four Wealth Groups
[insert image]
SOEP/DIW
Source of Table 1: Socio-Economic Panel (soep.v35), SOEP-P; own calculations with preliminary weights. Bottom half is percentile 0 to 50 of the net wealth distribution, upper middle class is percentile 51 to 75, the wealthy are percentile 76 to 98.5 and millionaires are the top 1.5 percent.
Table 2: Portfolio Compositions of Four Wealth Groups
[insert image]
SOEP/DIW
Source of Table 2: Socio-Economic Panel (soep.v35), SOEP-P; own calculations with preliminary weights. Bottom half is percentile 0 to 50 of the net wealth distribution, upper middle class is percentile 51 to 75, the wealthy are percentile 76 to 98.5 and millionaires are the top 1.5 percent.
Carsten Schröder, Charlotte Bartels, Markus M. Grabka, Johannes König and Rainer Siegers (DIW Berlin Researchers)
References:
Kaplan, G., Moll, B. and Violante, G.L. (2018), Monetary Policy According to HANK. American Economic Review, 108 (3): 697-743.
Schröder, C., Bartels, C., Grabka, M.M., König, J., Kroh, M. and Siegers, R. (2020a), A Novel Sampling Strategy for Surveying High Net‐Worth Individuals—A Pretest Application Using the Socio‐Economic Panel. Review of Income and Wealth. Series 66, Number 4, December 2020. doi: 10.1111/roiw.12452
Schröder, C., Bartels, C., Grabka, M.M., Göbler, K., König, J., Siegers, R., Zinn, S. (2020b), Improving the Coverage of the Top-Wealth Population in the Socio-Economic Panel (SOEP). SOEPPapers 1114. http://www.diw.de/documents/publikationen/73/diw_01.c.806917.de/diw_sp1114.pdf
